In the last week, you may have found that a leaderboard has become an unexpected addition to your morning routine. Every morning you now wake up, pick up your phone and check where your country sits on the Olympic medal table.
Although they look simple, leaderboards can have a big impact. Britain’s dismal position on the leaderboard at the 1996 Atlanta Olympics has been cited as a driving factor for Team Great Britain’s change in strategy. This change ultimately led to a meteoric rise up the leaderboards in Beijing, London, Rio and, potentially, Tokyo.
Leaderboards are now being used in more and more contexts outside of sport. Universities are ranked across the globe, which can bake funding inequalities into education. Cities’ tourist attractions are ranked on TripAdvisor. School league tables have such a disproportionate impact on parents’ and children’s decisions that there are numerous attempts to make them fairer through various (important) adjustments.
Behavioural science can point to some interesting design features in leaderboards. For example, peer comparison is a key ingredient in leaderboards and is a powerful tool for anyone wanting to change behaviour. In 2011 we worked with the then UK Department of Energy and Climate Change to develop a league table showing Departments’ progress toward a pan-government emissions target.
These were discussed by the Cabinet Secretary, Sir Gus O’Donnell, at his meetings with Permanent Secretaries. This introduced a competitive element to departmental performance and a strong incentive for departments to avoid the reputational loss of being seen to perform poorly on the Prime Minister’s commitment.
Leaderboards also force you to consider who is in your reference category. As someone who grew up in the UK, but is now living in Australia, it seems right to have a light repartee with colleagues about our countries’ performance on the medal table. Australia and Team Great Britain are consistently in the top ten.
As an Anglo-Indian, I can tell you that any attempts to start up some friendly banter with family in Chandigarh are both less fun and less well received, as India generally does not fare as well at the Olympics as Great Britain. (I would not be making the point if we were talking about Twenty20 International Cricket.)
By viewing leaderboards through this behavioural lens, we can identify some ways in which we can improve them. Based on BIT’s work over the last decade, we have gathered many insights on how to improve leaderboard design. Here are three of our favourites:
1. Make it Salient
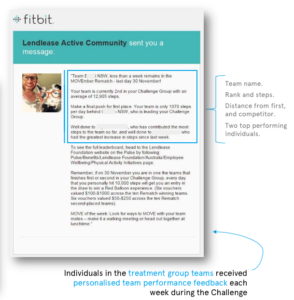
Leaderboards will only affect people’s behaviour if they see them. The more salient you can make them the better. This was demonstrated by a trial we ran with the Movember Foundation and Lendlease. Lendlease were already running a workplace competition to get their staff moving and had given everyone a FitBit to measure their performance. We worked with the Lendlease team to incorporate some behavioural insights into the leaderboard and ran an RCT to test the impact of these enhancements to the leaderboard.
One of the first things that we did was to increase the salience of the leaderboard by sending people in the treatment group personalised messages that highlighted where their group was in the leaderboard. We found that this personalised feedback increased the number of steps taken by 8%, with this impact being larger for women.
2. Ensure that it encourages competition where you want change
For most leaderboards, the main competition is at the top. It is more satisfying to move from 2nd position to 1st than it is to move from 188th to 187th. However, as the leaderboard designer, this may not be where you want most of the competition to happen— and beating the team directly in front of you is much more achievable than getting a place on the podium for most teams. If you want to encourage people to become more physically active then there are greater health benefits for encouraging people who historically are undertaking the fewest steps to do more.
In the Lendlease trial mentioned above we designed the personalised messages to draw participants’ attention to the teams that were directly ahead of them. This meant that the focus of the competition was no longer just at the top of the leaderboard, but up and down the whole leaderboard.
Everyone had a clear and achievable target. This is why our randomised controlled trial (RCT) found the effect of our messages was largest for those who had been the least active historically, with an increase of over 45% for those in the bottom quartile of activity.
We used the same method in a trial run with the New South Wales Department of Premier and Cabinet (DPC). Here we created a leaderboard to encourage people to come into the building at off-peak times. Entering the building during off-peak hours simultaneously increases the use of flexible working arrangements and reduces the burden on the transport system at peak hours.
Business units within DPC were ranked based on the number of times their team members entered the building during peak hours. Like the Lendlease trial, we messaged teams to tell them how far the team directly ahead of them was and how far the team directly behind them was. These messages increased the number of staff arriving at work outside peak hours by 7%.
3. Be aware of the underlying social dynamics
The Olympic medal table ranks teams, not individuals. In some cases some individuals have much more leverage than others to move their team up a position. A single swimmer can compete in multiple events, whereas an individual field hockey player can only compete for one gold medal.
The importance of understanding how this difference in leverage affects teams’ social dynamics was highlighted by a trial we ran with Timboon and District Healthcare Service and VicHealth. The aim of this project was to increase their staffs’ daily step count. We randomly assigned half of the teams the goal of walking 2,500 steps more than their own personal historical average. These goals were calibrated on their individual past performance. The other half were given a team-based goal, based on exceeding the historical average of the team by 2,500 steps each.
For the teams where individuals had to beat their personalised goals, all team members had relatively achievable goals. However, in the groups with the team-calibrated goals, some team members had to show much greater improvement to benefit their team than others. People who were already doing high levels of exercise did not have to change their behaviour, but those who historically did less had to walk many more steps to help their team. This did not help team morale. In our RCT, we found that the personalised target accounted for an increase of more than 550 steps per week compared to the group-based target.
The three tips above are a good starting place for using leaderboards to change people’s behaviour. However we have many more! You can also contact alex.gyani@bi.team to hear more tips.
Thanks to all my colleagues who were involved in this work,especially Karen Tindall, Hugo Harper and Rory Gallagher. Also thanks to the Movember Foundation, Timboon and District Healthcare Service, VicHealth, Lendlease and the NSW Department of Premier and Cabinet for supporting and funding the work described here.