As part of BIT North America’s work with the Bloomberg Philanthropies What Works Cities initiative, we have launched ten randomized control trials in six cities from Kentucky to California in the last six months. While we wait for the results, we thought we’d share three stories that shed some light on BIT’s methodology and let you know what we’ve been up to in our first few months in the US.
The (randomized control) Trial
First up, a city that — like many — is already equipped to run randomized control trials but didn’t know it.
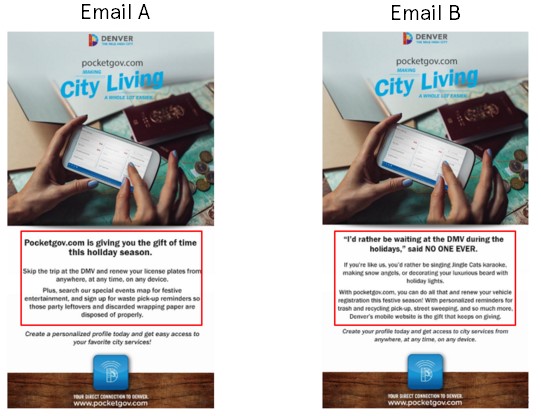
The marketing team at our wonderful partners, the City of Denver, uses MailChimp — an emailing software that includes built-in A/B test features. During a visit to the city, we were able to help them run a simple experiment to answer a simple question: which email would get more more people to click through to Denver’s online Department of Motor Vehicles (DMV) service? — email A or email B?
The two emails are shown below – the messages in the red boxes vary and the first line appears as a preview in email inboxes.
The results showed that email B led to a 14% increase in recipients opening and a 17% increase in the number of people who clicked through (both changes were statistically significant at p < 0.05). Denver saw an additional 300 sign-ups to pocketgov.com and is now planning further A/B tests at no additional cost.
On the Road (with code enforcement)
Almost all the US cities we are working with are interested in applying behavioural insights to Code enforcement.
For the uninitiated, codes and regulations teams work to ensure that residents are keeping their property in good repair. They can issue violations and fines where this is not the case. Compliance is monitored by inspection, and this costs money: $33 per inspection by BIT calculations. Limiting the number of inspections without compromising effectiveness is a constant challenge.
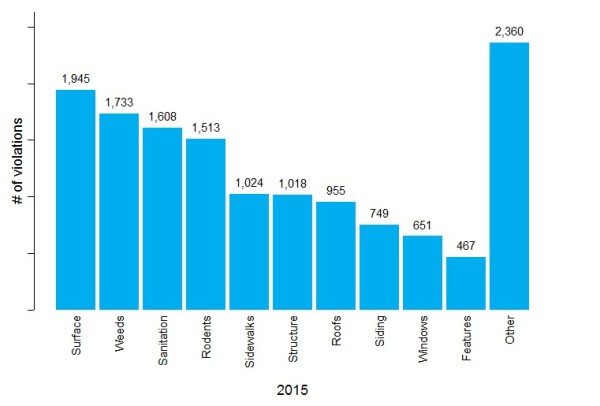
One of the What Works Cities projects is working with a city to reduce these costs. The current process is to inspect the property after receiving a complaint and then let the property owner know which violations he/she has. As the top ten most frequent violations account for 83% of all violations and most properties have five violations or fewer, BIT proposed sending owners suspected of non-compliance a letter before their first inspection with a list of the most common violations. The hope is that owners will fix any common violation before their first inspection, thereby removing the need for every case to have a second inspection.
Number of Violations by Type in 2015
A randomized control trial is currently in the field and will tell us if this approach is a success, but the underlying calculation is promising: if just six owners comply before their inspection each month the intervention pays for itself.
A Tale of Two Summary Statistics
Finally, a story involving missed court appearances to illustrate how BIT decides where we think an intervention will be most effective.
For lower level offenses — think violations involving alcohol, trespassing, and public urination — cities around the US give an on-the-spot summons that requires defendants to appear in court around a month later. No-show rates can be high. In one of our partner cities, where the immediate cost of a failure-to-appear is $151, the no-show rate is 41%. This adds up, and — by our calculations — in 2015, no-shows cost the city over $1.5 million.
So how do we address this issue? What’s the right point to intervene? And whose behavior should we focus on changing?
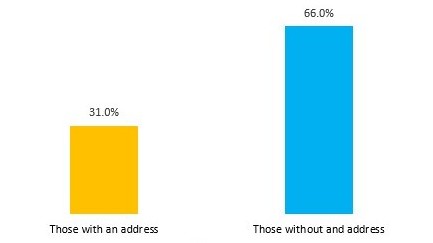
The answer is, of course, to start with the data. The city’s analysis shows that defendants without an address (who are homeless) fail to appear twice as much as those with an address.
Percentage of people who fail to appear at court (Jan-Sept 2015)
Just looking at this data would suggest that interventions should target how to get more homeless defendants to show up in court, an outcome that benefits both the city and the defendant. However, the issues facing homeless defendants make it clear that this isn’t an easy task and a closer look at the data reveals a much more addressable issue lurking just beneath the surface.
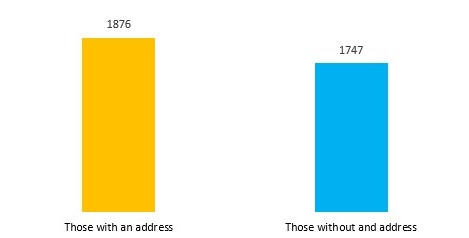
When we shift our focus to absolute numbers we find that defendants who fail to appear have an address 52% of the time; the fraction of homeless no-shows is higher but the absolute number of those who fail to appear is comparable across those with and without an address.
Number of people who fail to appear at court (Jan-Sept 2015)
This makes for an easier challenge — how do we get those with an address to show up at court? Now we are in the territory of small low-cost tweaks: testing timely postal reminders, or making the repercussions of not showing up more salient at the time of issuance. The money the courts will recover from reducing the number of failure-to-appears this time around could pay for support services and more expensive interventions that will help the most vulnerable.
Keep your eyes peeled for more updates: we will be sharing trial results from North America over the coming weeks.


