Last year, the UK sweltered through its hottest summer on record, with droughts declared nationwide. And if this June – the hottest June since records began – is anything to go by, the signs point to this becoming a more regular occurrence in 2023 and beyond. It is a jarring wake-up call: even in ‘rainy’ Britain water shortages loom large, posing what has been described as an ‘existential threat’. To avert such crises in the future, we must slash our daily water consumption from 142 litres to a minimum of 110 litres per person by 2050.
There are two paths to tackle this challenge. The first involves pricey infrastructural upgrades—think fixing leaky pipes, constructing new reservoirs, and establishing efficient transfer networks. Unfortunately, these improvements often translate to higher costs for water customers. But there’s a second, more affordable option: reducing the amount of water we consume through the application of behavioural insights.
The first hurdle in cutting water consumption is our lack of awareness about how much we actually use each day, week, and month. However, as water meter adoption has grown, water companies have gained access to customer data that can be helpfully fed back to customers with the aim of increasing awareness of water consumption behaviours. In turn, it is hoped that customers will respond to this feedback and reduce their household water use.
We teamed up with Affinity Water and design agency Outré Creative to redesign customer bills through a behavioural lens and provide customers with feedback on their water consumption. At the end of last year, we published the results from the interim analysis. Here, we summarise the approach we took and present final results from our field trial.
A new, behaviourally designed bill
Through an iterative co-creation process with Affinity Water, customers and Outré Creative, we designed a new, behaviourally-informed, customer bill.
The new bill is more intuitive, useful, and motivating. Specific features included personalised feedback on water consumption using physical metaphors, the use of plain English (like litres, rather than m3), and social comparisons so people can gauge how much water they use compared to similar households in their local area.
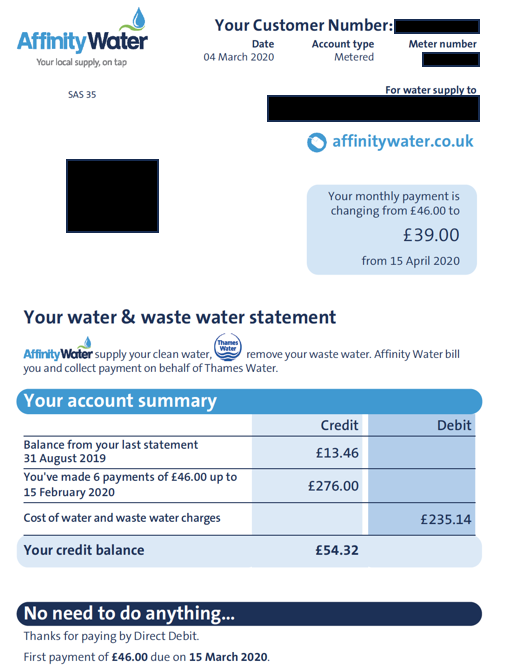
Before vs after – Page 1 of the redesigned bill
A large-scale field RCT to measure impact on water consumption
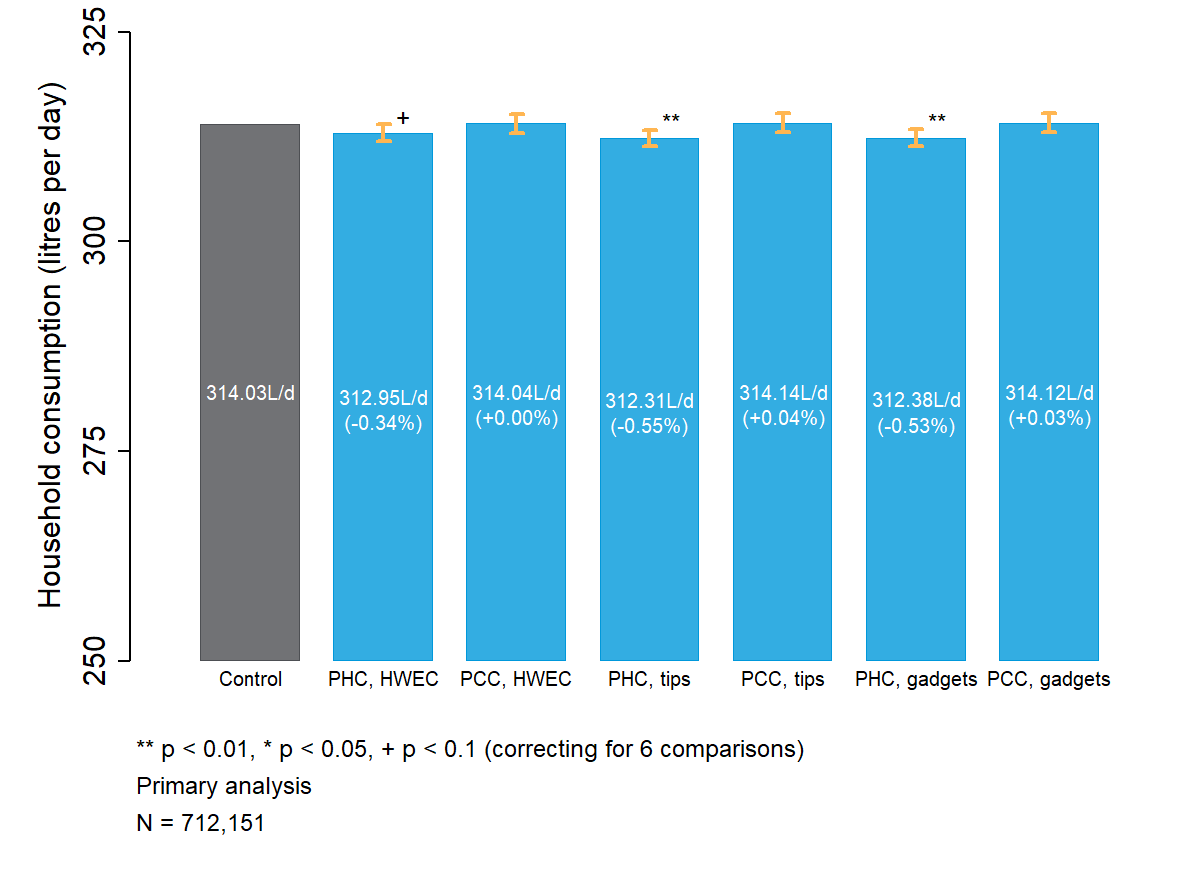
To test the impact of these changes, we conducted a large-scale field randomised control trial (RCT) with around 712,000 metered Affinity Water customers. Customers began to receive the new bill from July 2021. We analysed their water consumption up to (and including) December 2022, estimating the impacts of the redesigned bills on water consumption over 12 months for each household.
We randomly varied certain ‘modules’ within the new bill to identify the impact that specific elements have on water consumption. We also compared these versions of the new bill to a ‘fabricated control bill’ – a redesigned bill with behaviourally-informed modules stripped back or replaced by white space. The variations tested:
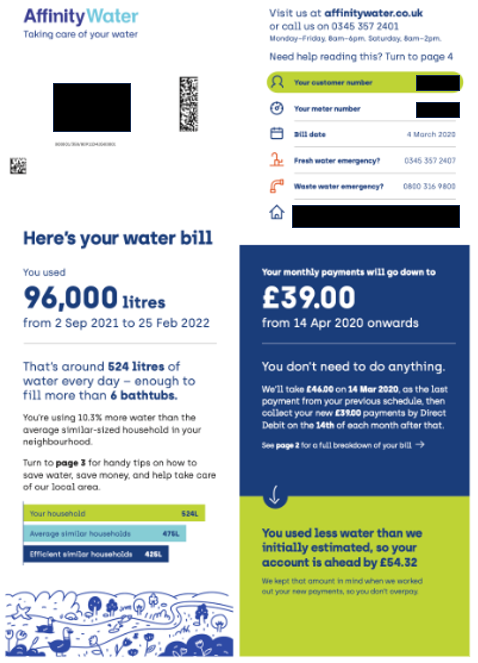
1) How we provided feedback to customers on their consumption: ‘per household’ consumption (PHC) vs ‘per capita’ consumption (PCC). Both of these styles of feedback help make a family’s water usage less abstract. The PCC style is more common in the water industry, but we hypothesised that the social comparisons to similar households (the PHC style) would outperform the traditional style by leveraging social norms.
‘Per household’ consumption comparisons (left-hand side) versus ‘per capita’ consumption comparisons (right-hand side)
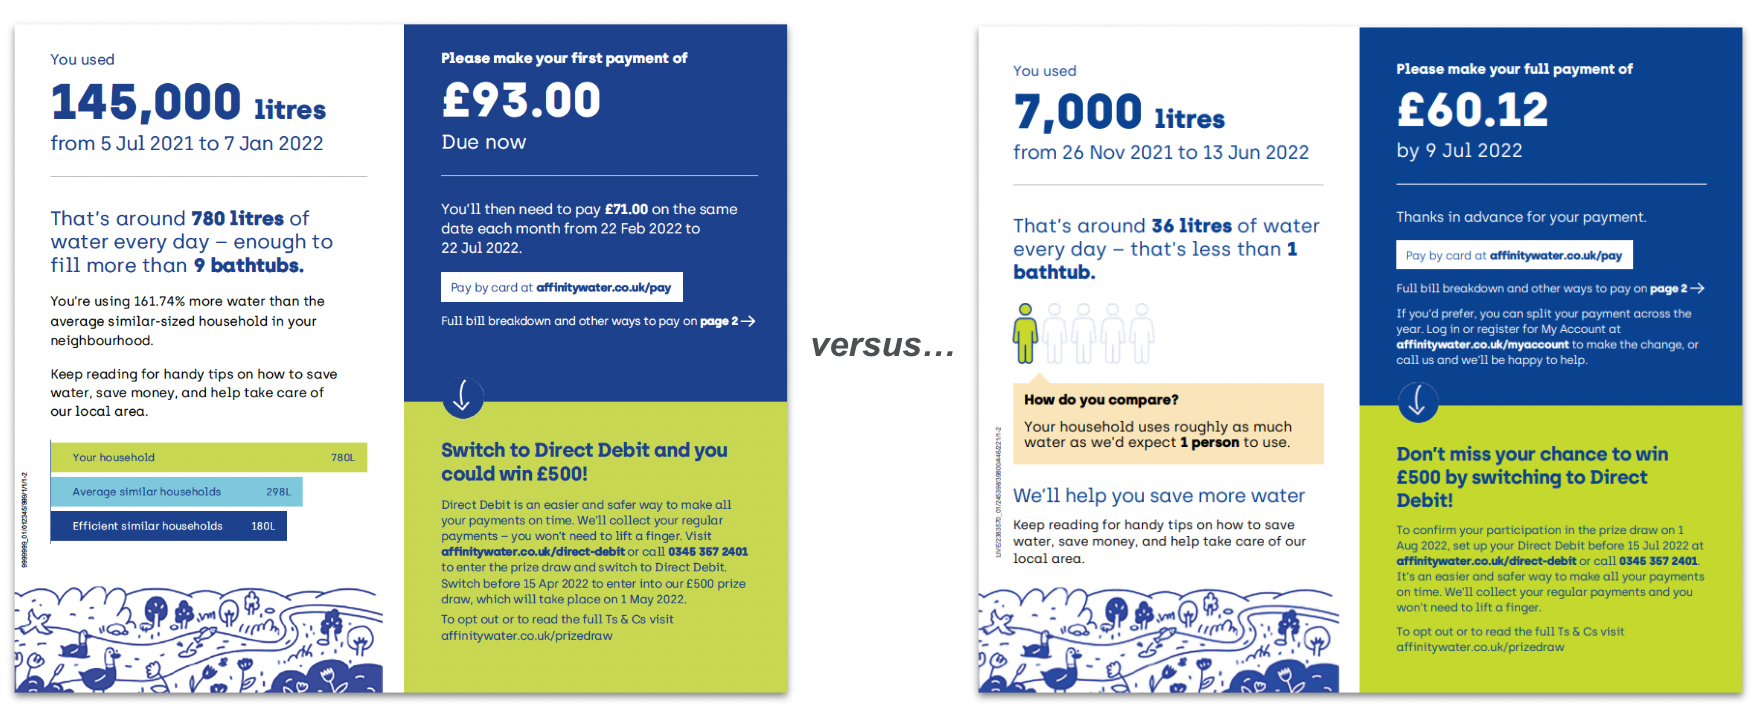
2) What kind of encouragement we provided: an offer for a Home Water Efficiency Check, free water-saving gadgets or water-saving tips.
Encouragement to book a home water efficiency check (left-hand side) versus tips (middle) versus encouragement to order gadgets (right-hand side)
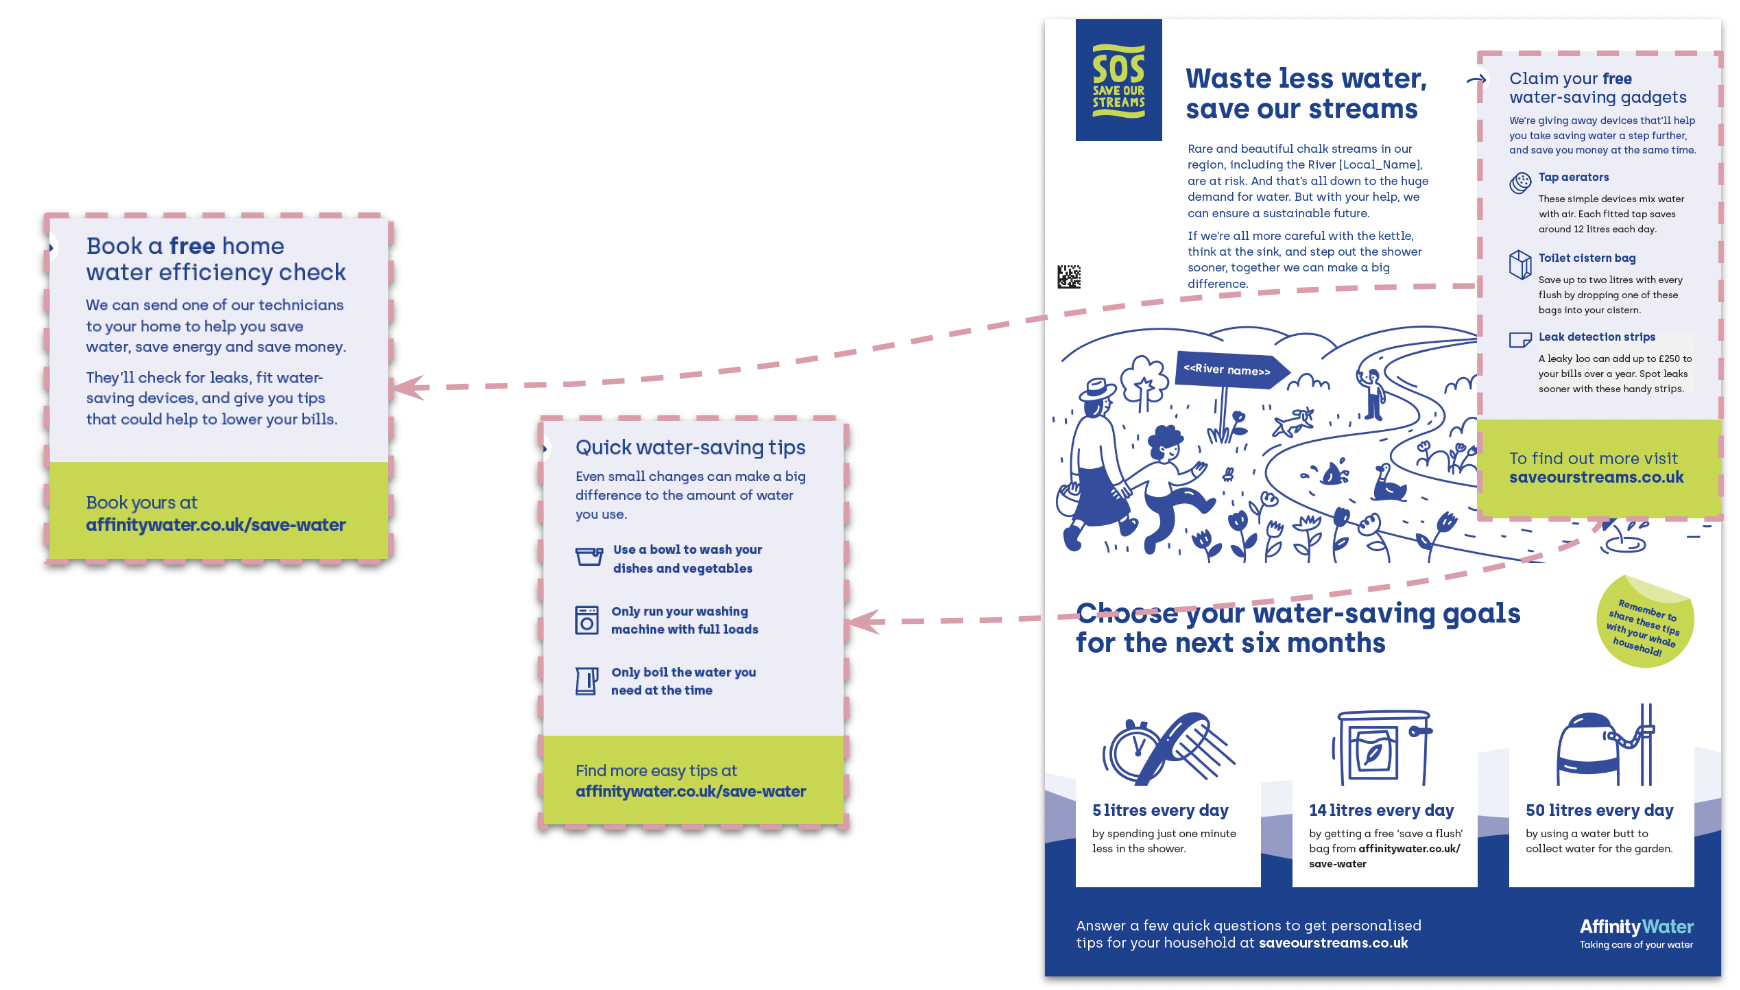
Each bill’s exact content and module design depended on a customer’s situation. An example is the social comparisons to similar households. Approximately 50% of customers consumed more than the ‘average similar household’ (left-hand image below). But the other 50% were better than average – and some of these customers were even better than efficient similar households (see the top-right and bottom-right images for examples of the feedback Affinity Water gave those groups of customers).
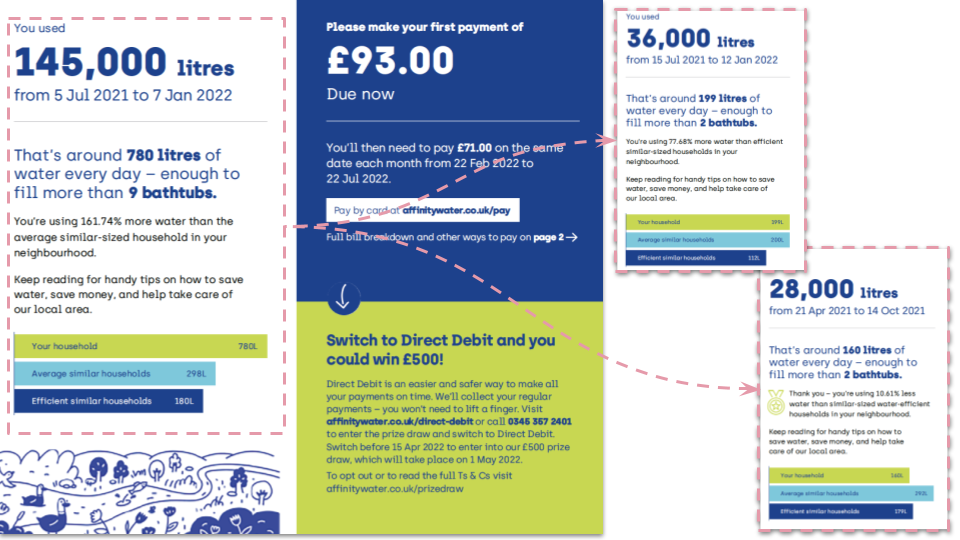
Affinity Water, BIT, and Outré Creative designed these modules carefully; for example, customers doing better than efficient similar households are explicitly thanked for their good work.
What we found
PHC comparisons achieved small but meaningful reductions in water consumption
- All PHC comparisons bills achieved statistically significant reductions in consumption compared to the control group.
- Conversely, none of the PCC comparison groups reduced consumption.
- Of the PHC groups, the ones with the tips and gadgets offer modules had the largest estimated reduction of consumption (of roughly 0.5%).
- The finding suggests that providing customers with an external point of comparison (ie comparing water consumption to others) may act as a stronger, more informative point of reference for adjusting behaviour compared to per capita comparisons. We also theorise that PHC comparisons were relatively easier for customers to interpret whether they are doing better or worse than average.
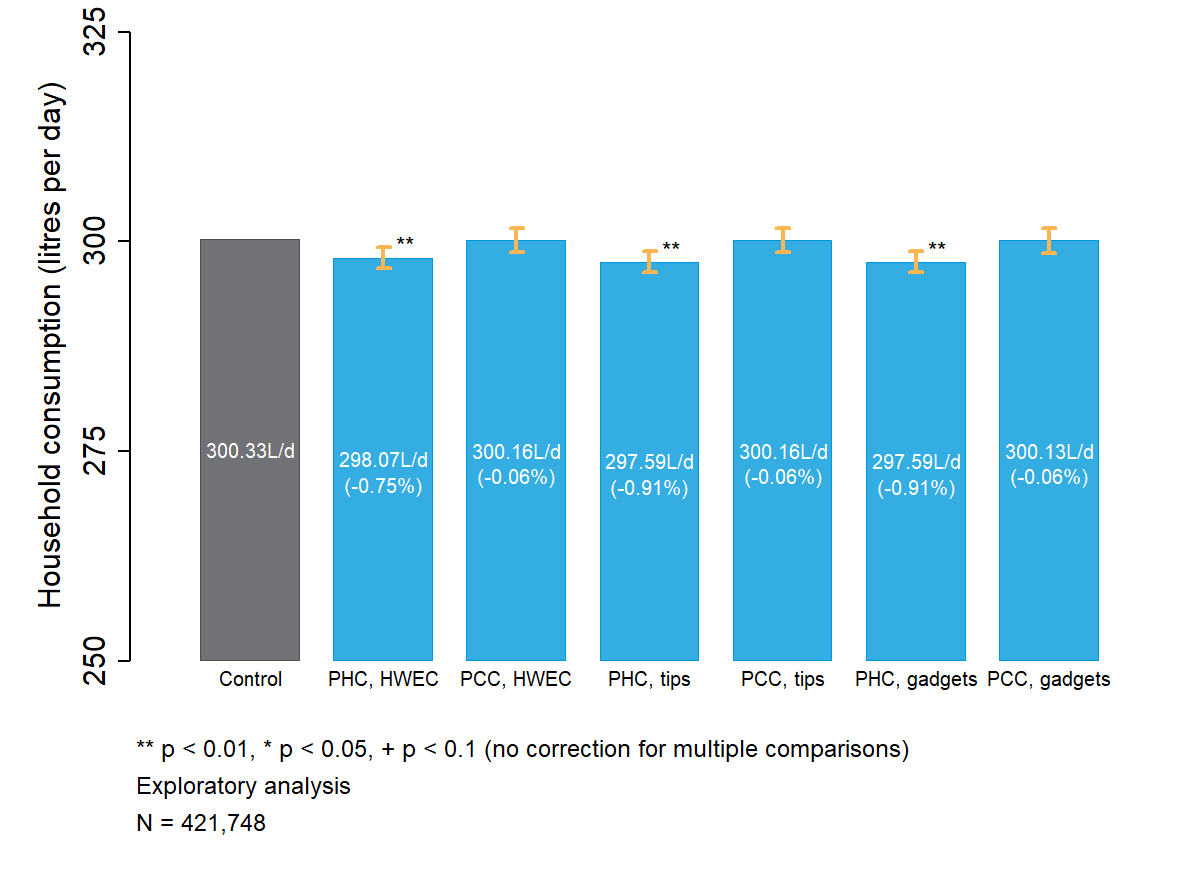
The effects on reduced water consumption were larger among paper-billed customers
- The effect was larger among customers who received paper bills via post resulting in 0.7%-0.9% reductions for all PHC groups.
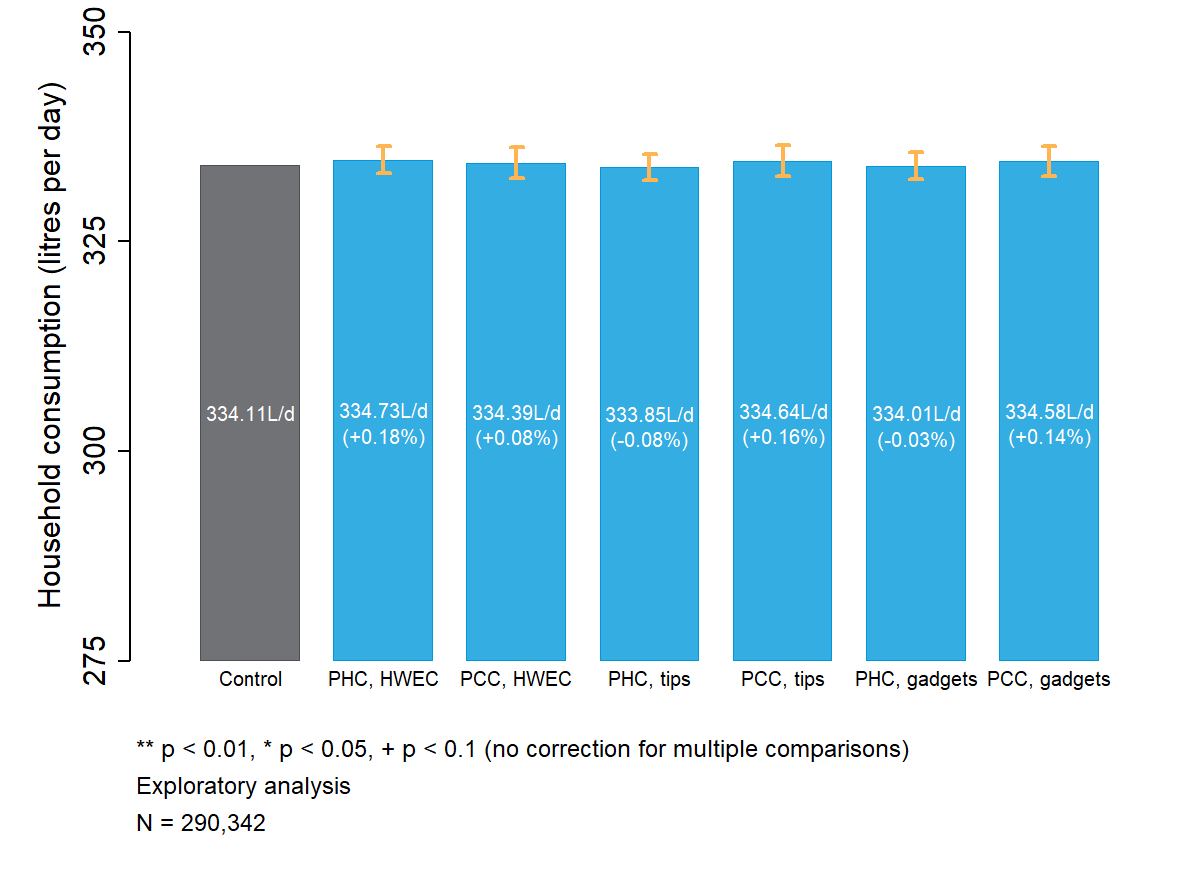
- There was no effect among customers who received their bills via email.
- We believe this difference was due to paperless customers being less likely to open and engage with their bills compared to paper customers. This finding suggests that more work is needed to identify more effective ways of providing feedback to paperless customers.
Paper-billed customers
Paperless customers
The impact of small changes adds up
Although 0.5% reductions from the redesign might seem small, when scaled across Affinity Water’s customer base, the total reduction adds up to a major impact.
- Total savings from the trial among the 712,000 customers in the final sample are estimated to be 250 million litres.
- If Affinity Water was to switch every metered customer to the best-performing bill version (PHC comparisons + tips), we estimate total savings could be up to 600 million litres per year.
If you are part of the water sector and interested in exploring ways behavioural insights could be applied to reduce water consumption, we would love to hear from you.